


Annual Letter to Stakeholders
2025 in Review & Looking Forward to 2026
To the Stakeholders of Stars & Stripes Financial Advisors,
I have the great privilege and responsibility of helping our clients navigate life’s financial complexities. I am honored by the trust our clients have put in me to do so. Part of that responsibility is to share those critical factors which have implications for your financial life. It is with pleasure that I write to you directly about these topics.
War with Iran
By now everyone is aware that a new war in the Middle East has begun. Here are a few things I pray that you keep in mind as we navigate this new reality.
The war fighters that are being sent over there are our sons, daughters, brothers and sisters. Many of them have their own families and spouses they are responsible for and who love them dearly. They are our neighbors and our friends.
When they come back home our job is not to judge them on the merits of the war. Our job is to support them as they reintegrate into civilian society and to keep the promises we made to them when they volunteered for service.
It is our sacred honor to support and serve those who volunteered and we must never forget that.
Possible Financial Impact of War
When the U.S. goes to war, a few things typically happen to the markets and the economy that are worth noting.
First, there is usually a small sell-off in the markets but as uncertainty subsides things tend to stabilize. It is typical to have positive returns in the stock market in the year in which a war begins. I can’t say if that will happen again but it is worth noting. The stock market is very resilient.
Second, wars usually have a net negative impact on the economy over the long run but provide a short-term stimulus. As government debt increases to finance wars, the accelerated spending tends to exacerbate inflation and deficits. It also steers capital, talent and other resources away from productive efforts in the economy. These negative effects of war are partially offset by the need for governments to boost spending in the short-term to pay for beans, bullets and soldiers. War is not cheap and conducting war in this day and age means setting up entire supply lines across the globe to sustain combat efforts. This is no small effort and will likely boost short-term GDP numbers at the expense of long-term growth.
From a more people-oriented perspective, this war means another generation of war fighters may have to put their lives at risk. They will carry the burden of service like so many have before them. It is incumbent upon us to ensure that they come home to a community that cares about them and the resources they were promised so they can have access to quality healthcare, education and the American Dream. We owe them this and it is our sacred duty to ensure they get what they are owed.
The Great Tax Shift of 2025
The most consequential change to our tax policy in 100 years happened at the beginning of 2025, and the importance of it was lost on most people.
Many people were aware of the widespread tariffs and the “One Big Beautiful Bill”, OBBB for short. However, it became clear from conversations with friends, family and clients that many people missed the forest for the trees.
Tariff Tax
For starters, a number of people did not, and maybe still don’t, understand what tariffs are. Tariffs are a tax paid by importers on goods from other countries. Tariff taxes are not paid by foreign companies or countries. Tariffs are a tax that is paid to customs officials by importers when they receive goods at ports of entry. A simple but applicable analogy is that tariffs are like a sales tax that importers pay. Sales taxes make things more expensive for the consumer to buy and so do tariff taxes.
The only alternative to tariff taxes making things more expensive for the consumer is for domestic businesses to become less profitable. In reality what we saw was a combination of both more expensive imported goods and smaller profit margins for the U.S. companies that sell those goods.
The importers, in this case U.S. businesses, must pass along the cost of tariff taxes if they want to protect their profit margins. If they choose not to pass along those costs then they must absorb those costs themselves which results in less profit for the company. In short, tariff taxes have made consumers and businesses in the United States less well-off economically than they otherwise would have been.
We should not be surprised by the notion that an increase in taxes goes hand-in-hand with less purchasing power for those being taxed. Which segues into the next thing I think people have largely missed about these tariff taxes.
Tariffs have, and always will be, a heavier burden for those who need to spend more of their money on physical goods. The logic follows that the lower a person is on the income distribution, the larger the portion of their expenditures goes to things like food, vehicles, clothes and other physical items. The more affluent a person is the more likely that an ever-increasing amount of their expenditures is on services instead of goods.
A great example of this is comparing the person who allocates money to purchasing a lawnmower vs the person that allocates money to a lawn mowing service.
As a result of this time tested and observable fact of life, tariff taxes are considered a form of regressive taxation. A regressive tax system means a person’s effective tax rate actually increases as their income decreases. This shifts the tax burden onto those who are least capable of absorbing that economic impact.
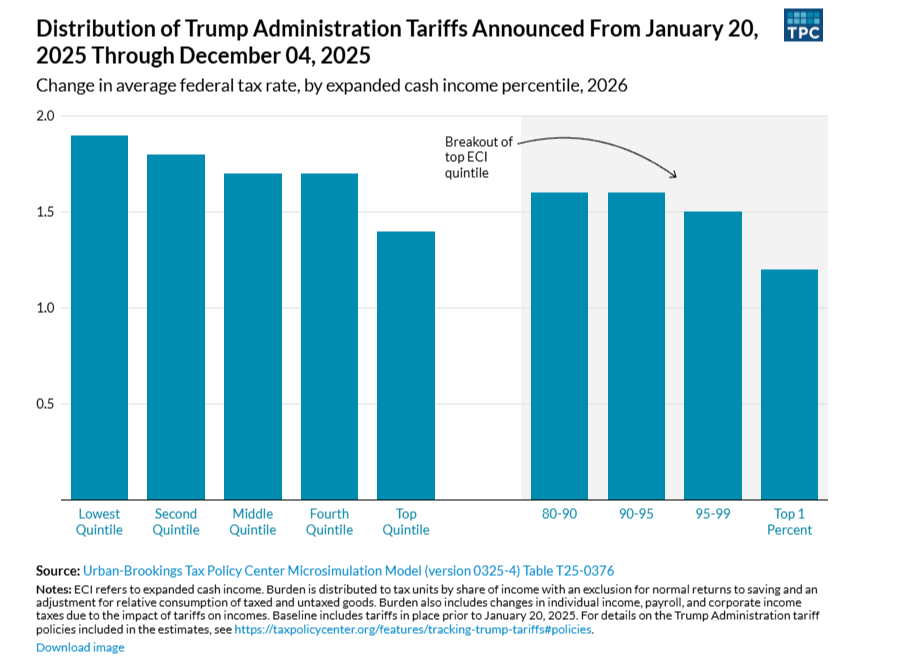
Source: https://taxpolicycenter.org/features/tracking-trump-tariffs
If you wanted to increase taxes on the poor and middle classes of society you could hardly wish for a better vehicle for it than a tariff tax.
The OBBB
If tariffs were about increasing taxes on the lower and middle classes of the income distribution then the OBBB was about lowering taxes on the wealthiest portion of society, namely business owners and executives.
Business Tax Cuts
In total, the cuts to various types of taxes on business were the largest. Some of the most notable were making permanent or accelerating depreciation expenses on things like machinery, equipment, software, R&D and in certain cases entire buildings. Previously those types of capital expenditures had to be depreciated over several years if not decades. Now companies can write-off the entire cost of these expenses in the year in which they occur resulting in tremendous tax advantages.
Pass-Through Business Deduction
The Qualified Business Income (QBI) deduction of 20% was made permanent. For many business owners this means a 20% off the top reduction in their taxable income. As the amount of income increases the value of the tax break increases with it. This results in the vast majority of this tax break going to the highest income earners in this category.
Estate Taxes
Let’s take a look at the estate tax provision. The OBBB raised the federal exemption for estate tax to $15 million per person, or $30 million per couple. It was set to revert to $7 million per person or $14 million per couple before the bill was passed into law in the event that the TCJA provisions sunset. The effect of this is that the top 0.1% of the wealthiest households can now transfer an additional $16 million tax-free to their children netting them a one-time reduction in taxes of $6.4 million (40% tax rate multiplied by the increase of the exemption amount of $16 million). The estate tax exemption also gets adjusted up annually with inflation and was made permanent by this law.
Reduction of the Top Marginal Tax Rate
The OBBB cut tax rates or extended the Tax Cuts and Jobs Act (TCJA) rates for many of the brackets except the lowest tax bracket and those who individually make between $250,525 and $626,350 (people in the top 2% to 5% of the income distribution).
Pre-TCJA/OBBB | Net Change in Percentage Points | Post OBBB |
10% | 0% | 10% |
15% | -3% | 12% |
25% | -3% | 22% |
28% | -4% | 24% |
33% | -1% | 32% |
35% | 0% | 35% |
39.5% | -2.5% | 37% |
In purely monetary terms these changes were estimated by the Congressional Budget Office to provide approximately $1.66 trillion of benefit to the 12.2 million households in the top 10% of the income distribution over the next 10 years. [1]
The Net Effect
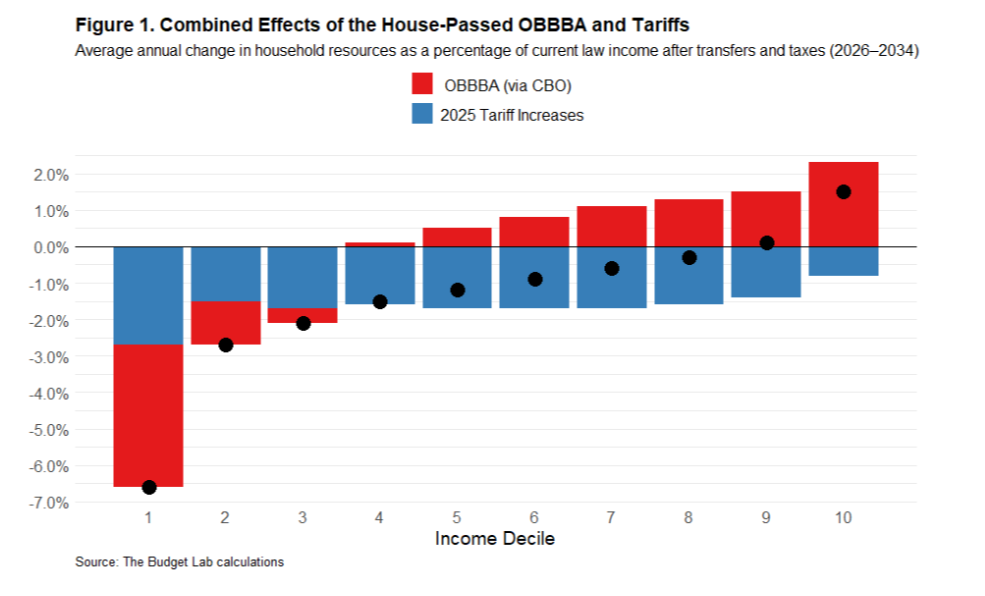
When taken together, the OBBB and Tariff taxes negatively affect the bottom 80% of the income distribution and positively affect the top 20% of the income distribution. If you look at the data by income decile, it becomes clear that nearly all of the benefit accrues to the top 10% of earners.
What this Means for You
We can never be certain about what the future holds. That applies to tax provisions and laws just the same. As of this writing, the Supreme Court of the United States had ruled that a large portion of the tariff taxes invoked under the IEEPA authorization were indeed unconstitutional and unlawful[2]. Additionally, there are various efforts in Congress to undo some of the damage done to lower income households that was put upon them by the OBBB and its enablers. What comes next from this administration is anyone’s guess.
With that said, why not make the most out of any situation you find yourself in?
One obvious way to make the most of the tariffs is to use it as motivation to delay those big purchases. Whether you are talking about furniture, cars, or appliances each of them is either made abroad or uses imported materials. Squeezing out a few extra months or years from what you have is not only thrifty in general but may be extra beneficial if you can outlast what may be a temporary tariff tax. Don’t beat yourself up if you have to make a purchase but do not overlook the value of hiring someone to fix what you have to make it last a little longer. My wife and I recently had our refrigerator repaired for just $250. That was a big win compared to the cost of a brand-new fridge. Unfortunately, we could not do the same for our dishwasher.
Starting a business has rarely looked this good. With the number of tax breaks for businesses and business owners you may have an opportunity that doesn’t come around too often. It may be of particular interest to those who are looking at starting a capital intensive or research-intensive businesses that allow for large up-front write-offs.
Market Performance for 2025: A Case for Diversification
The markets did quite well during 2025, but investors who focused their assets too narrowly on U.S. equities alone missed out big.
One of the most watched, and often overinvested in, parts of the market is the S&P 500 index. It is sometimes referred to as Large Cap stocks, short for large capitalization. This Large Cap index consists of the 500 most richly valued companies in the U.S. according to the markets. Over time, this part of the equity markets has on average outperformed most other equity indexes. However, history shows us that there are stretches of time in which large U.S. companies can underperform other parts of the market for many years in a row. For example, between December 31st, 2000 and December 31st, 2010, the All Country World Index excluding the U.S. (ACWI ex U.S.) had an aggregate return of 71.53% compared to the S&P 500 aggregate return of 15.07%. Some commentators referred to this period of time as “the lost decade”.
Looking at 2025 returns, the U.S. equity market underperformed the major international equity markets by a large margin. The following data reflects broad market indices and is provided as an example and for educational purposes.
- MSCI USA Large Cap Returns: 18.64%[3]
- MSCI USA Mid Cap Returns: 8.36%[4]
- MSCI USA Small Cap Returns: 11.63%[5]
- MSCI EAFE Returns: 31.22%[6]
- MSCI Emerging Markets Returns: 33.57%[7]
Note: Past performance is not indicative of future results. Asset class returns cited are broad market indices and are not reflective of any specific portfolio.
U.S. GDP accounts for about 26% of global GDP but U.S. equity markets currently account for about 50% to 60% of global market capitalization. There are many valid reasons for this imbalance, but it serves as a reminder that there are many investment opportunities outside of the U.S. that one ought to consider when constructing a portfolio.
Two often-overlooked alternative asset classes that significantly outperformed equity markets around the globe last year were gold and silver. When investors in equities get scared, they tend to run to bonds, but when investors in bonds get scared, they tend to run to gold. Gold is sometimes referred to as a “safe haven” asset class because investors will turn to it in times of great uncertainty like we are in now.
While these returns are impressive, it is important to recognize that the long-term average returns for gold and silver are in the low-to-mid single digits. In normal market times these assets act as a drag on performance, but during times of heightened uncertainty and fear they can provide an effective counterbalance to help diversify your portfolio and reduce volatility.
U.S. Underperformance, a Data Point or a Trend?
Going forward there is reason to believe that U.S. underperformance may continue for the short-to-medium term.
Underpinning the massive flows of money into developed markets and emerging markets is a new understanding that the U.S. can no longer be counted on for predictability and open markets. As the U.S. makes isolationism a reality, the rest of the world has begun work to shore up its economic security. Among the main themes countries are pursuing: entering into trade agreements and pacts without the U.S., exercising monetary and fiscal stimulus to reinvest in their own economies and dropping the dollar to some degree to insulate themselves from a more extractive U.S. policy regime. All of these factors are the types of indicators that would lead one to reasonably believe those countries will benefit from a flood of economic stimulus.
On the other hand, the U.S. has implemented policies that hurt its economic interests. Among the most obvious are the tariff taxes, use of military force, and the extensive effort to cut federal jobs and spending. All of these pursuits would hurt the long-term economic well-being of any nation.
When it comes to the equity markets, this calls into question the very high multiples of valuation.
Shiller PE Ratio
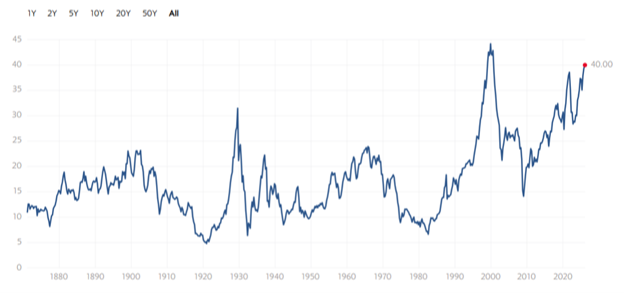
Source: www.multpl.com
If the AI boom does not materialize, or fails to live up to the expectations of the market, we may see slower earnings growth and a contraction in valuation multiples which could cause a significant drop in market prices. Our current Cyclically Adjusted Price-to-Earnings (CAPE) ratio as measured by the Case Shiller PE Ratio shown above is near Dot Com Bubble highs. Some market commentators have been pointing to the AI infrastructure spending boom as perhaps the only thing propping up the market. While the profits from those investments are by no means a certainty, we can say for sure the spending has really been happening and that spending is flowing to the bottom lines of other companies. One of the most notable sectors is energy companies that focus on the value chain for constructing and maintaining powerplants. That industry has done exceedingly well this past year.
In short, the market is in tension between the growth story of AI and the fiscal impediments of this administration’s policies. As is often the case, the short-term is highly unpredictable but over the long term I would hesitate to bet against the U.S. economy and our democratic republic’s ability to change course for the better. In the meantime, it may be worth taking a close look at what you are allocating to those international investments in your portfolio and keeping a strong safety buffer of cash on hand.
Signs of a Weakening Job Market
During 2025, the unemployment rate rose from 4.0% to 4.5%. In nominal terms, the total unemployed population grew from about 6.9 million people to about 7.8 million people, a net change of about 900,000 more unemployed people. Additionally, the length of unemployment on average increased in duration with those being unemployed for 27 weeks or longer growing by about 500,000 people. When looking at the population of people employed on a part-time basis, we also saw a softening. Those who worked part-time for economic reasons increased by about 800,000[10].
What this all means is that the employment situation during 2025 worsened across nearly every metric. Unemployment rose, the duration of unemployment increased, and the people who wanted to work more couldn’t find more work. A healthy job market typically requires unemployment to be below 4.5% and an addition of about 100,000 new jobs per month. Given the U.S. economy only added an estimated 359,000 jobs between January 2025 and January 2026, this means we ended the last 12 months about 800,000 fewer jobs than we would normally like to see. It is probably not surprising then that the total number of unemployed people rose by nearly the same amount (900,000).
If there was a bright spot in the jobs market, it would undoubtedly be the healthcare and social services sector. While the vast majority of industries lost jobs between January 2025 and January 2026, the healthcare and social services sector added about 773,000 jobs. Without this one sector the U.S. would have lost jobs in total over the past 12-months.
It’s a good time to be in the healthcare field.
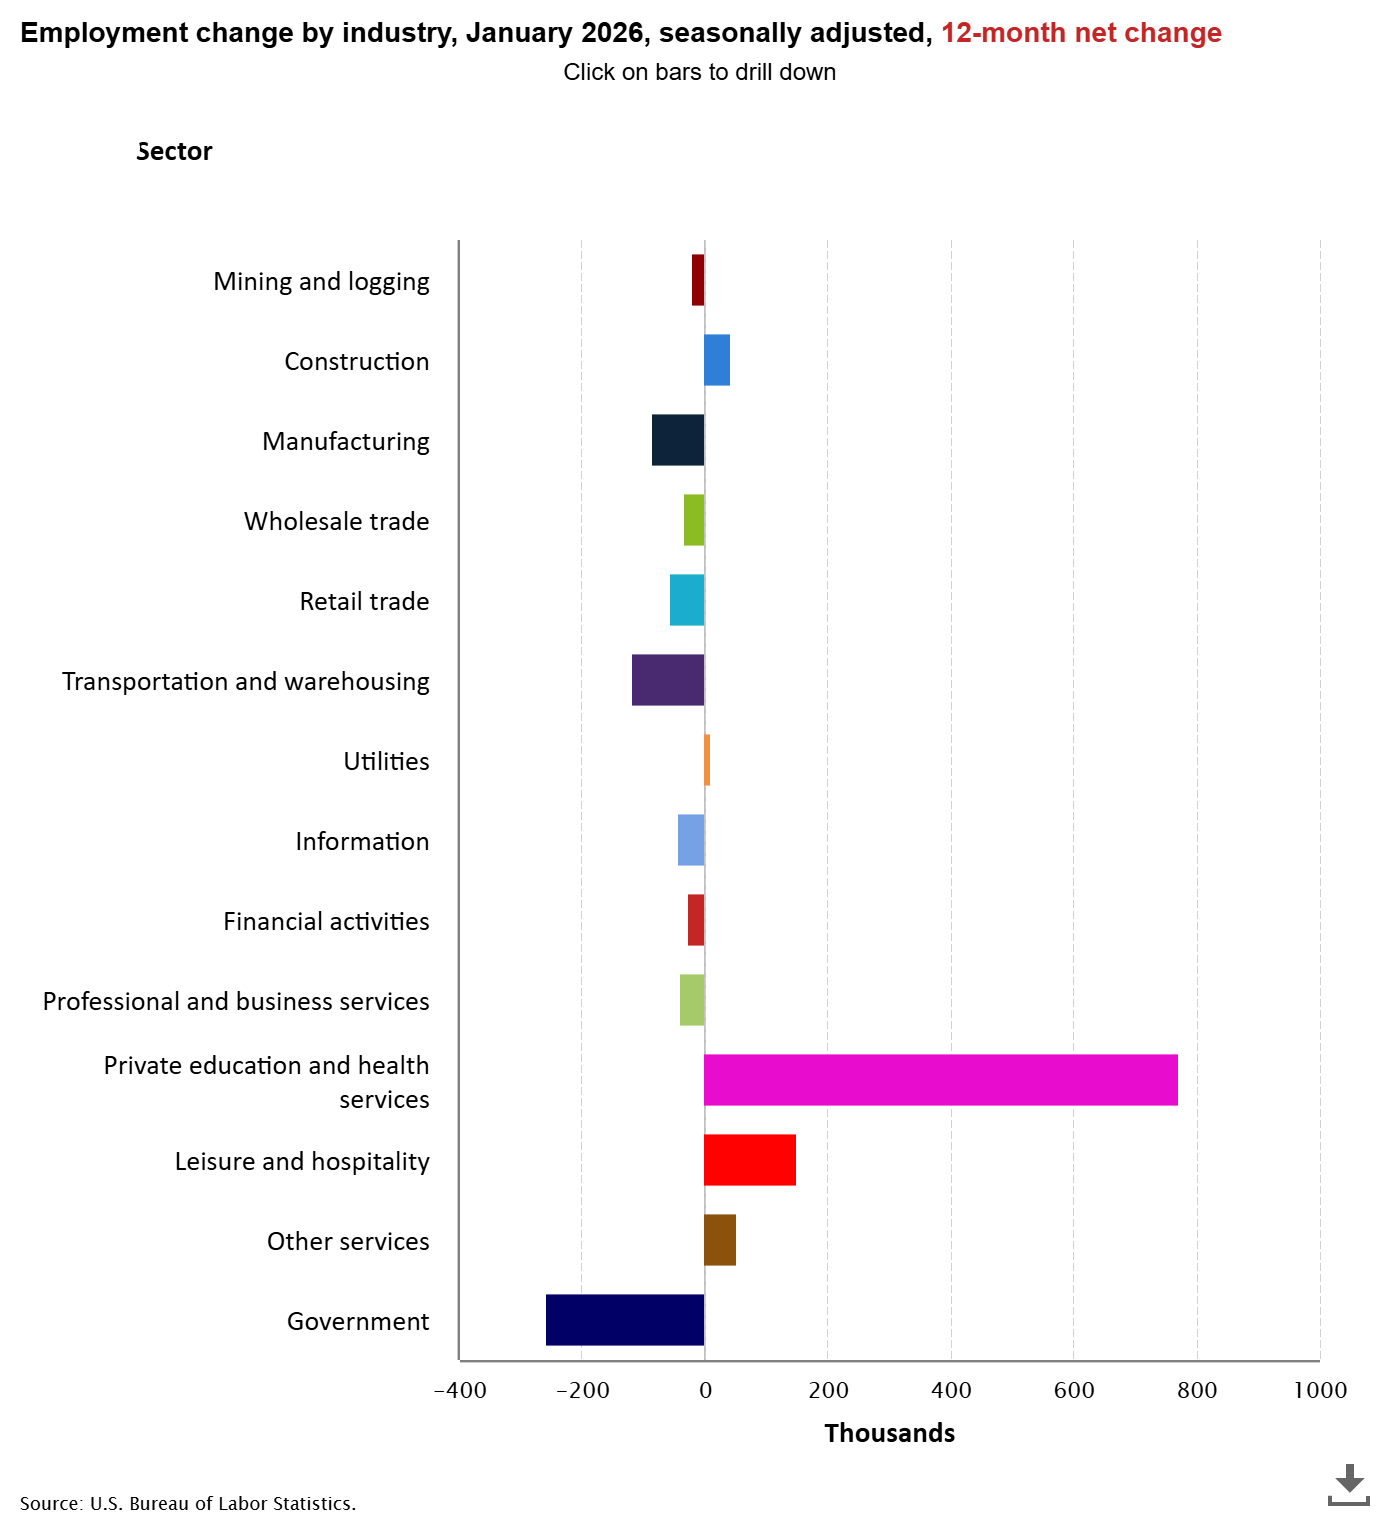
Source: U.S. Bureau of Labor Statistics
Inflation, Where We Go from Here
Inflation has been plaguing us since the beginning of 2021 shortly after Covid and the world started getting back to normal.
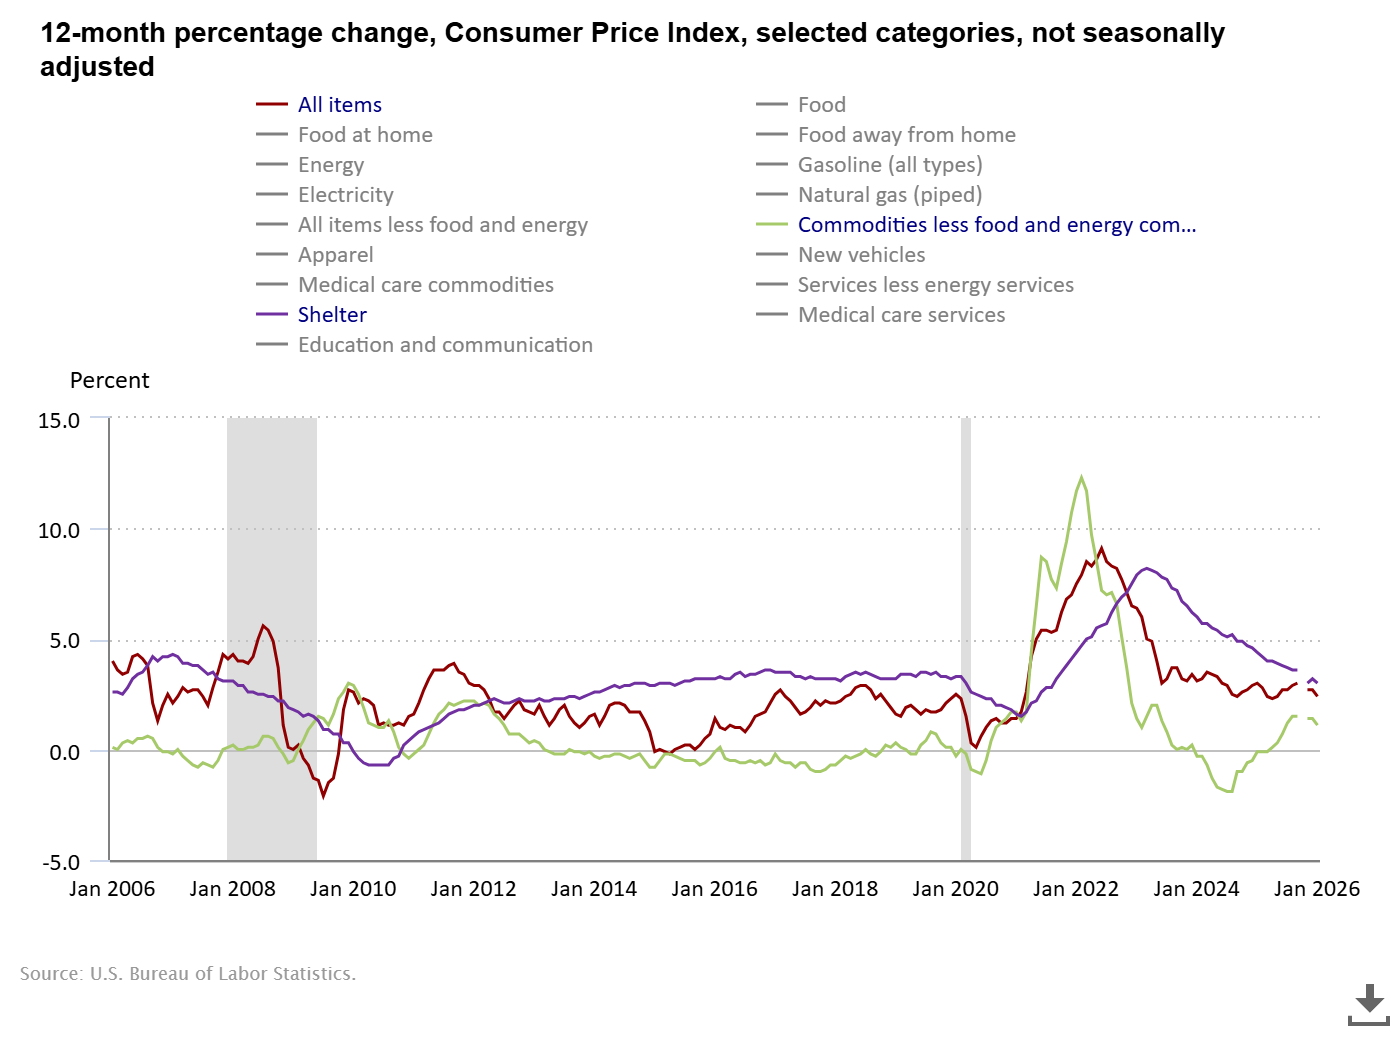
During October of 2024, JP Morgan announced that the Federal Reserve (“Fed” for short) had pulled off a soft landing with regards to inflation. Basically, they were stating that the Fed had managed to reduce inflation into a normal range without knocking the U.S. economy into a recession, something that the Fed has a terrible record with. However, shortly after that our current president was elected on a policy platform of tariff taxes. Tariff taxes, being a cost added to consumers, put upward pressure on inflation. While the Fed has toiled away at the work of setting interest rates with a steady hand so as to strike a balance between inflation and full employment, we have seen the rate of inflation oscillate between 2.4% and 3.0% ever since. The latest reading on inflation was 2.4% which is exactly what it was in September 2024 just before JP Morgan announced the “soft landing.” Basically, we have made no progress on inflation in the last year and a half.
Source: U.S. Bureau of Labor Statistics
I like to include commodities and shelter as line items in the inflation chart because they are leading and lagging indicators, respectively. As the chart above shows, commodities are somewhat lower and declining again. This leading indicator is one reason to believe that our inflation will continue to slow in the coming months. Additionally, Shelter, a lagging indicator, is also still falling but has narrowed the gap substantially with the overall inflation level. My hope is that as shelter inflation slows, it will help anchor the rest of inflation at a lower level since it has historically made up a very large part of the economic basket of goods measured when calculating inflation. I suspect we will see lower inflation as the months roll on.
Where Are Interest Rates Now and Where Are They Expected to Go?
The reason we keep a close eye on inflation and the jobs data, besides the direct and personal relevance to your everyday life, is because they affect decisions about how the Fed sets interest rates. When interest rates drop, it makes lending easier, which boosts economic output, lowers the cost of living and running a business and improves the valuation of the companies we invest in through the stock market. However, there is a balance to be struck.
Decreasing interest rates too far, too fast, or for too long can cause a phenomenon known as hyperinflation. Hyperinflation is a hallmark of autocracies that have handed over technocratic decision making to political loyalists who don’t know what they are doing. A recent famous example of hyper-inflation is Venezuela in the 2010’s. During that period entire swaths of the economy were nationalized and once loyalists were in charge of the money supply the money printing began. The country was increasing its money supply by 20% to 30% per month. Inflation reached at least 130,000% per year with prices doubling every two weeks. As a result, GDP contracted by over 75% and millions of people fled the country.
It is our responsibility to ensure such technocratic decision-making stays in the hands of people more concerned with our wellbeing than their personal politics.
The Federal Funds Rate is currently set at 3.5% to 3.75% and is projected by the Fed to be reduced to 2.9% to 3.6% before the end of 2026[11]. That is not exactly a big decrease for the calendar year but is helpful for setting expectations for those of us who may want to use financing for any reason.
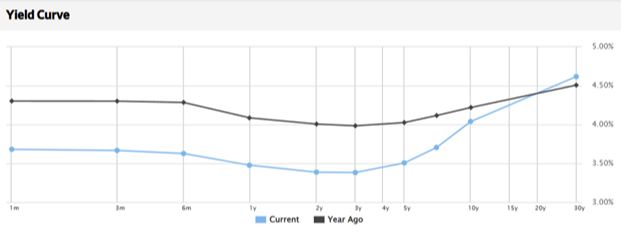
Source: WSJ, https://www.wsj.com/market-data/bonds?mod=nav_top_subsection
I think it is reasonable to expect that if inflation continues to slow and the job market doesn’t recover in a serious way, that the Fed will have no choice but to continue to reduce the interest rates that they set.
It is critical to note that when interest rates go down, bond prices go up. The yield curve above shows that the short- to medium-term interest rates decreased across the board in the past 12 months. This is part of the reason the bond market had a good year last year. Bond market performance may continue to benefit if rates continue to decline, though outcomes remain uncertain.
What Does All This Mean for You?
I often say that we cannot tell what the future holds, but we can assess what the current state of affairs is. If there is one thing that is certain right now, it is that we are living in a time of uncertainty.
In times like these, where there is a high degree of uncertainty in fiscal, monetary, and geopolitical policy in addition to high market valuations, weakening job markets, and frustrating levels of inflation, it pays to keep your options open and be defensive in your strategic approach. For many households, a prudent approach right now may include maintaining strong cash reserves, focusing on improving cash flows, and investing in highly liquid and reliable assets. These principles are almost always sound strategies to follow, but in times like these they may pay extra dividends in the form of less stress and anxiety.
A realistic approach to wealth building is a lifelong endeavor that requires discipline in times of certainty and uncertainty. By implementing automatic transfers into key accounts and systematizing your investments, you can automate your wealth building and relieve yourself of some of the burden that comes with maintaining discipline.
By considering both your risk tolerance and your risk capacity when making investment decisions, you can align your portfolio to work with your level of comfort and not against it. When you are comfortable with your investments, you may find it is easier to stay invested and allow compounding interest to work for you on your wealth building journey.
Let’s work smarter, not harder.
News About Stars & Stripes Financial Advisors
Last year was a great year for Stars & Stripes Financial Advisors. Our top line revenue grew by roughly 100% while our expenses only increased by a little over 20%. These are excellent numbers compared to those firms we benchmark ourselves against. However, in light of the slow growth year we had in 2024, we believe that by averaging out the performance it puts us closer in line with industry averages but still well above the median.
Our revenue growth was driven by all three business segments, Comprehensive Financial Planning, Investment Management Services, and Hourly Financial Advice. A good portion of our clients came to us last year as a result of referrals from existing clients. To those of you who made referrals and recommended us to your friends and family, thank you for your trust and confidence! We will endeavor to work to provide them with the same level of service, honor and integrity we have served you with.
The increased costs we incurred are almost entirely due to increases in spending associated with marketing and business development activity. As we grow as a business, it will be necessary to reach new audiences and find future clients where they are. I will monitor these expenditures closely and measure them against their effectiveness. In short, I’ll keep my pencil sharp.
We are also implementing a new client agreement and payment processing effort this year designed to reduce administrative burden both on our clients and us. The new effort will no longer require annual client agreement renewals and will pin fee increases to the CPI+0% as measured two months before the renewal date. We believe this is in keeping with our commitment to putting our clients first and being as transparent about our pricing as humanly possible. If you are a client, please stay vigilant for an email on this topic as it relates to you specifically.
Finally, I am pleased to announce that we are now registered with the State of North Carolina. All this means is that we are now able to take on as many clients from that state as we can manage. It is not an endorsement by the state in any way, shape, or form. This is another critical step in our strategic growth plan as a firm to ensure we provide access to every military member, veteran and their family member.
What Our Clients Receive
Stars & Stripes Financial Advisors was created so military service members, veterans and their families could have access to quality financial planning and advisory services without having to worry about the conflicts of interest inherent at many other financial services companies. That is why Stars & Stripes Financial Advisors operates as a fee-only fiduciary.
Being a fiduciary means our financial advisors have the legal and ethical duty to put their client's best interests above their own - thereby upholding the confidence, good faith, and trust vested in them. A fiduciary duty is the highest standard of care that a financial advisor can adhere to. This means the advisor is legally required to always put their client’s interests ahead of their own in all dealings. Where conflicts are unavoidable, the advisor must resolve those conflicts in their client’s favor. As long as I run Stars & Stripes Financial Advisors this duty to our clients will remain the centerpiece of our practice.
If you are new to these letters, it may surprise you to learn that many financial advisors are not held to a fiduciary standard or take the fiduciary oath. Some financial advisors operate under different regulatory frameworks. In general, financial advisors are allowed to provide advice that is merely "suitable" even if it is not in the client's best interest. The key difference between a financial advisor who is a fiduciary and a typical non-fiduciary financial advisor lies in the requirements that distinguish them. Among these differences is being mandated to provide advice that is in the best interest of their client at all times and not just when making recommendations.
One of the major challenges facing military service members, veterans and their families is the lack of access they have to quality financial advice that is unbiased. Most financial advisors are required to charge an Assets Under Management (AUM) fee to their clients. The problem with this is three-fold:
First, you must have financial assets to manage for the company to justify doing business with you. After all, how can they charge a fee on your assets if you have no assets to charge a fee on? Second, the assets must be of great enough value (asset minimums) that the advisors’ fee provides them with enough income for their business model to work. A typical asset minimum is in the range of $500,000 to $1,000,000. Third, the assets must be liquid enough that the advisors can take possession of the assets through a custodian and so they may charge a fee for managing the assets. Many “financial advisory” firms are really nothing more than investment management firms. As such, they are less inclined to serve people who have pensions, compensatory disability, real estate investment properties, or own their own business. As you can imagine this excludes many military and veteran families.
Some estimates have indicated that the AUM (Investment Management) business model that most financial advisors use results in a full two-thirds of households not having access to financial advice at all.
The community we serve at Stars & Stripes Financial Advisors – military service members, veterans, and their families – are less likely than the average household to have access to financial advice under this outdated business model because a disproportionate amount of their financial well-being comes from pensions, disability income, or access to special benefits through organizations like the VA and state level tax exemptions.
Our solution to this problem has been to provide financial advice on a fee-only basis. Instead of requiring our clients to have a certain amount of assets for us to manage, we simply ask our clients to pay us like they would any other professional, namely on an hourly or monthly basis, for the services we provide. While we also offer investment management services for which we charge an AUM fee, as other firms do, we do not make it a requirement, nor have we implemented asset minimums.
Most importantly, what our clients receive is a financial advisor they can trust and depend on through all of life’s ups and downs.
Purpose First. Integrity Always. ™
Commitment to Service
Service is an important component of what makes us who we are, and I couldn’t be prouder of our commitment to help volunteer with The Travis Manion Foundation, Georgia 4-H’s Military Programs, and Building Homes for Heroes in partnership with NAPFA (National Association of Personal Financial Advisors). These organizations serve the military and veteran community of which we are a part. Please consider volunteering yourself or donating to their causes in whatever way you can.
- Travis Manion Foundation: https://www.travismanion.org/
- Georgia 4-H: https://georgia4h.org/programs/focus-areas/citizenship/military-programs/
- Building Homes for Heroes: https://www.buildinghomesforheroes.org/
- NAPFA: https://www.napfa.org/
Looking forward into the new year, we will continue to focus on serving our clients and giving back to the community we hold so dear. We remain committed to expanding access to financial advice to more military members, veterans and their families. If you know a military member, veteran or family member who might benefit from financial planning or advice, please send them our way. As a Service-Disabled Veteran Owned Small Business (SDVOSB), word of mouth referrals is our lifeblood.
It is our honor and privilege to serve you. May this year bring prosperity, purpose, and joy to you and your family!
At Your Service,

Phillip Hulme, CFP®
Chief Financial Advisor and CCO
Stars & Stripes Financial Advisors

